
Newry House Prices Jump 16% in a Year
Adding £35,000 Since 2024
Based on Latest NI Property Data


Home » Newry House Prices Increase 16% in 1 Year
Despite remaining up to £90,000 cheaper than nearby areas, catch-up growth is accelerating.
- Newry house prices up 16% year-on-year
- £35,000 added in under 18 months
- Average price now ~£205,000
- Expert Commentry - "The average 10% deposit has risen from £17,600 to £20,500 in 18 months"
- £65k–£90k gap vs surrounding premium areas
- District growth now outpacing NI average
Newry City: Catching Up From Historic Lows - Increasing 16% year-on-year
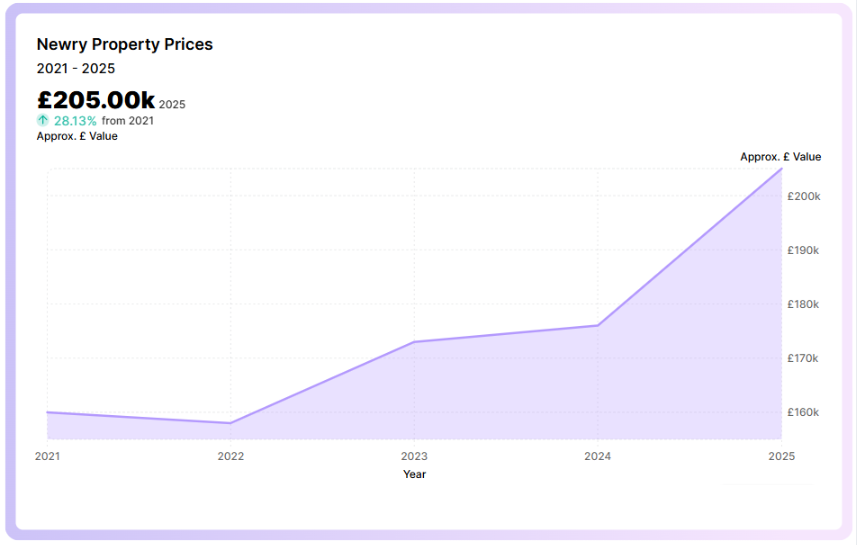
Average Prices in Newry (All Property Types)
| Year | Avg price |
|---|---|
| 2021 | ~£160,000 |
| 2022 | ~£158,000 |
| 2023 | ~£173,000 |
| 2024 | ~£176,000 |
| 2025 | ~£205,000 |
What the Trend Shows
Newry lagged during the high mortgage rate period
Prices accelerated sharply from late 2024
Around £35,000 added in under 18 months
Expert Commentry

“The average 10% deposit has risen from £17,600 to £20,500 in 18 months.
This is classic catch-up behaviour. Newry stayed more affordable during the high-rate period, so once mortgage rates began easing, demand returned quickly. When that happens, prices can rise faster than many expect, and as borrowing levels increase, mortgage insurance becomes more important than ever.”
Electoral Area Comparison: A District of Contrasts (Including Newry)
Average Prices by Area (Q4 2025)
| Area | Avg price | Property basis | Market signal |
|---|---|---|---|
| Newry (City) | ~£205k | All property types | Catch-up affordability zone |
| Crotlieve | ~£295k | All property types | High-premium commuter market |
| Rowallane | ~£270k | All property types | Supply-constrained growth |
| The Mournes | ~£255k | All property types | Lifestyle premium holds |
| Downpatrick | ~£245k | All property types | Stable, low volatility |
| Slieve Croob | ~£235k | All property types | More volatile |
| Slieve Gullion | ~£230k | All property types | Best value growth |
Key Insight
There is now a £65k–£90k price gap between Newry city and several surrounding electoral areas, a gap that is actively reshaping buyer behaviour.
Northern Ireland Housing Market: The Conditions Driving Growth
Northern Ireland’s housing market has entered a new phase, one shaped by strong buyer demand, improving mortgage sentiment, and a persistent shortage of homes for sale.
While national averages tell part of the story, they hide what’s really happening on the ground.
This data-led report looks at the market through three connected lenses:
Northern Ireland overall
Newry, Mourne & Down District
Newry city itself
Together, these layers reveal why Newry is now one of the most important and most misunderstood housing markets in Northern Ireland.
| Category | Metric | Q4 2025 |
|---|---|---|
| Prices | Average price (all properties) | £235,035 |
| Annual price growth | +6.4% | |
| Quarterly price growth | +1.1% | |
| Supply | New listings in Q4 | 4,179 |
| Total inventory change (YoY) | -8% | |
| Demand | Buyer enquiries per listing | Highest since 2021 |
What This Means
Demand has rebounded faster than supply. Fewer homes are available than a year ago, while buyer confidence has improved following interest rate cuts in late 2025.
This combination creates price pressure, particularly in markets where:
Entry prices are still relatively low
Supply is structurally limited
Buyers can compromise on property type rather than location
Newry fits all three conditions.
Supply in Context: Why Newry, Mourne & Down Feels Tighter Than It Looks
Looking only at raw listing numbers can be misleading. The real insight comes from comparing listings share to population and land area.
Listings Share vs Population & Geography
| Area | Share of NI listings | Share of NI population | Share of NI land area |
|---|---|---|---|
| Newry, Mourne & Down | 7% | 9.6% | ~11% |
| Belfast | 23% | ~18% | Much smaller |
Why This Matters
Newry, Mourne & Down supplies fewer homes for sale than its population and size would suggest. When demand improves, this imbalance tightens the market quickly.
This is a key structural reason prices can move faster here than the NI average.
This imbalance means even modest increases in demand can translate into faster price growth than the Northern Ireland average.
Newry, Mourne & Down District: Outperforming Northern Ireland
District Prices (Q4 2025)
| Area | Avg price (all properties) | Annual growth |
|---|---|---|
| Northern Ireland | £235,035 | +6.4% |
| Newry, Mourne & Down | £258,212 | +7.1% |
Interpretation
The district isn’t just rising it’s outpacing the national average. However, that growth is not evenly spread, which leads directly to the Newry city story.
Why the Price Gap Exists and Why It’s Closing
Why Newry Is Cheaper Than Surrounding Areas
Property mix: Urban areas have more terraces and semis; rural areas skew toward detached homes.
Lifestyle premiums: Mournes, Rowallane and Crotlieve command space, scenery and commuter premiums.
Supply distribution: Low stock in premium areas pushes prices up faster there first.
Why Newry Prices Are Rising Now
Displacement demand: Buyers priced out of £270k–£300k markets pivot to Newry’s ~£205k level.
Mortgage sensitivity: Improved affordability impacts lower-priced markets first.
Catch-up dynamics: Markets that lag during downturns often rebound fastest.
Newry is no longer a slow-growth market it’s a catch-up market, and that’s when price momentum tends to be strongest.
Demand & Mortgages: The Fuel Behind the Shift
- Buyer enquiries per listing are at multi-year highs
- Mortgage rates eased in late 2025
- Further reductions are expected into 2026
What This Means for Newry
For Buyers
One of the lowest average entry points in the district
Rising competition, particularly for urban family homes
Window of opportunity may narrow quickly
For Sellers
Liquidity improving in Newry city stock
Accurate pricing by neighbourhood is critical
Well-presented homes outperform averages
Methodology
The insights in this article are based on rigorous data analysis using PropertyPal’s Q4 2025 Northern Ireland Housing Market Update and dynamic house price data from PropertyPal.
Figures reflect asking price trends and market averages rather than individual transaction prices.
Data Sources
PropertyPal Q4 2025 Housing Market Report
This quarterly report provides authoritative figures on:Average residential property prices across Northern Ireland and regional districts
Annual and quarterly price growth percentages
Sales listings and inventory trends
Buyer enquiry ratios (demand indicators)
Dynamic House Price Data from PropertyPal
Using PropertyPal’s postcode and electoral area level price data, we derived:Average house prices for specific local areas within Newry, Mourne & Down
Longitudinal trends (2021–2025)
Price comparisons between Newry city, surrounding electoral areas, and the wider NI market
Data Sources
[2] https://www.propertypal.com/house-prices/newry-mourne-and-down
[3] https://www.propertypal.com/house-prices/newry-mourne-and-down/crotlieve
[4] https://www.propertypal.com/house-prices/newry-mourne-and-down/downpatrick
[5] https://www.propertypal.com/house-prices/newry-mourne-and-down/newry
[6] https://www.propertypal.com/house-prices/newry-mourne-and-down/rowallane
[7] https://www.propertypal.com/house-prices/newry-mourne-and-down/slieve-croob
[8] https://www.propertypal.com/house-prices/newry-mourne-and-down/slieve-gullion
[9] https://www.propertypal.com/house-prices/newry-mourne-and-down/the-mournes